
Once you sign up to market your brand or business on Instagram, it’s best to go about it the right way so you can get the most impressive results.
Instagram analytics is the key to getting the best out of your business account, showering you with critical information to take charge of your market share and turn followers into addicts.
What is Instagram analytics?
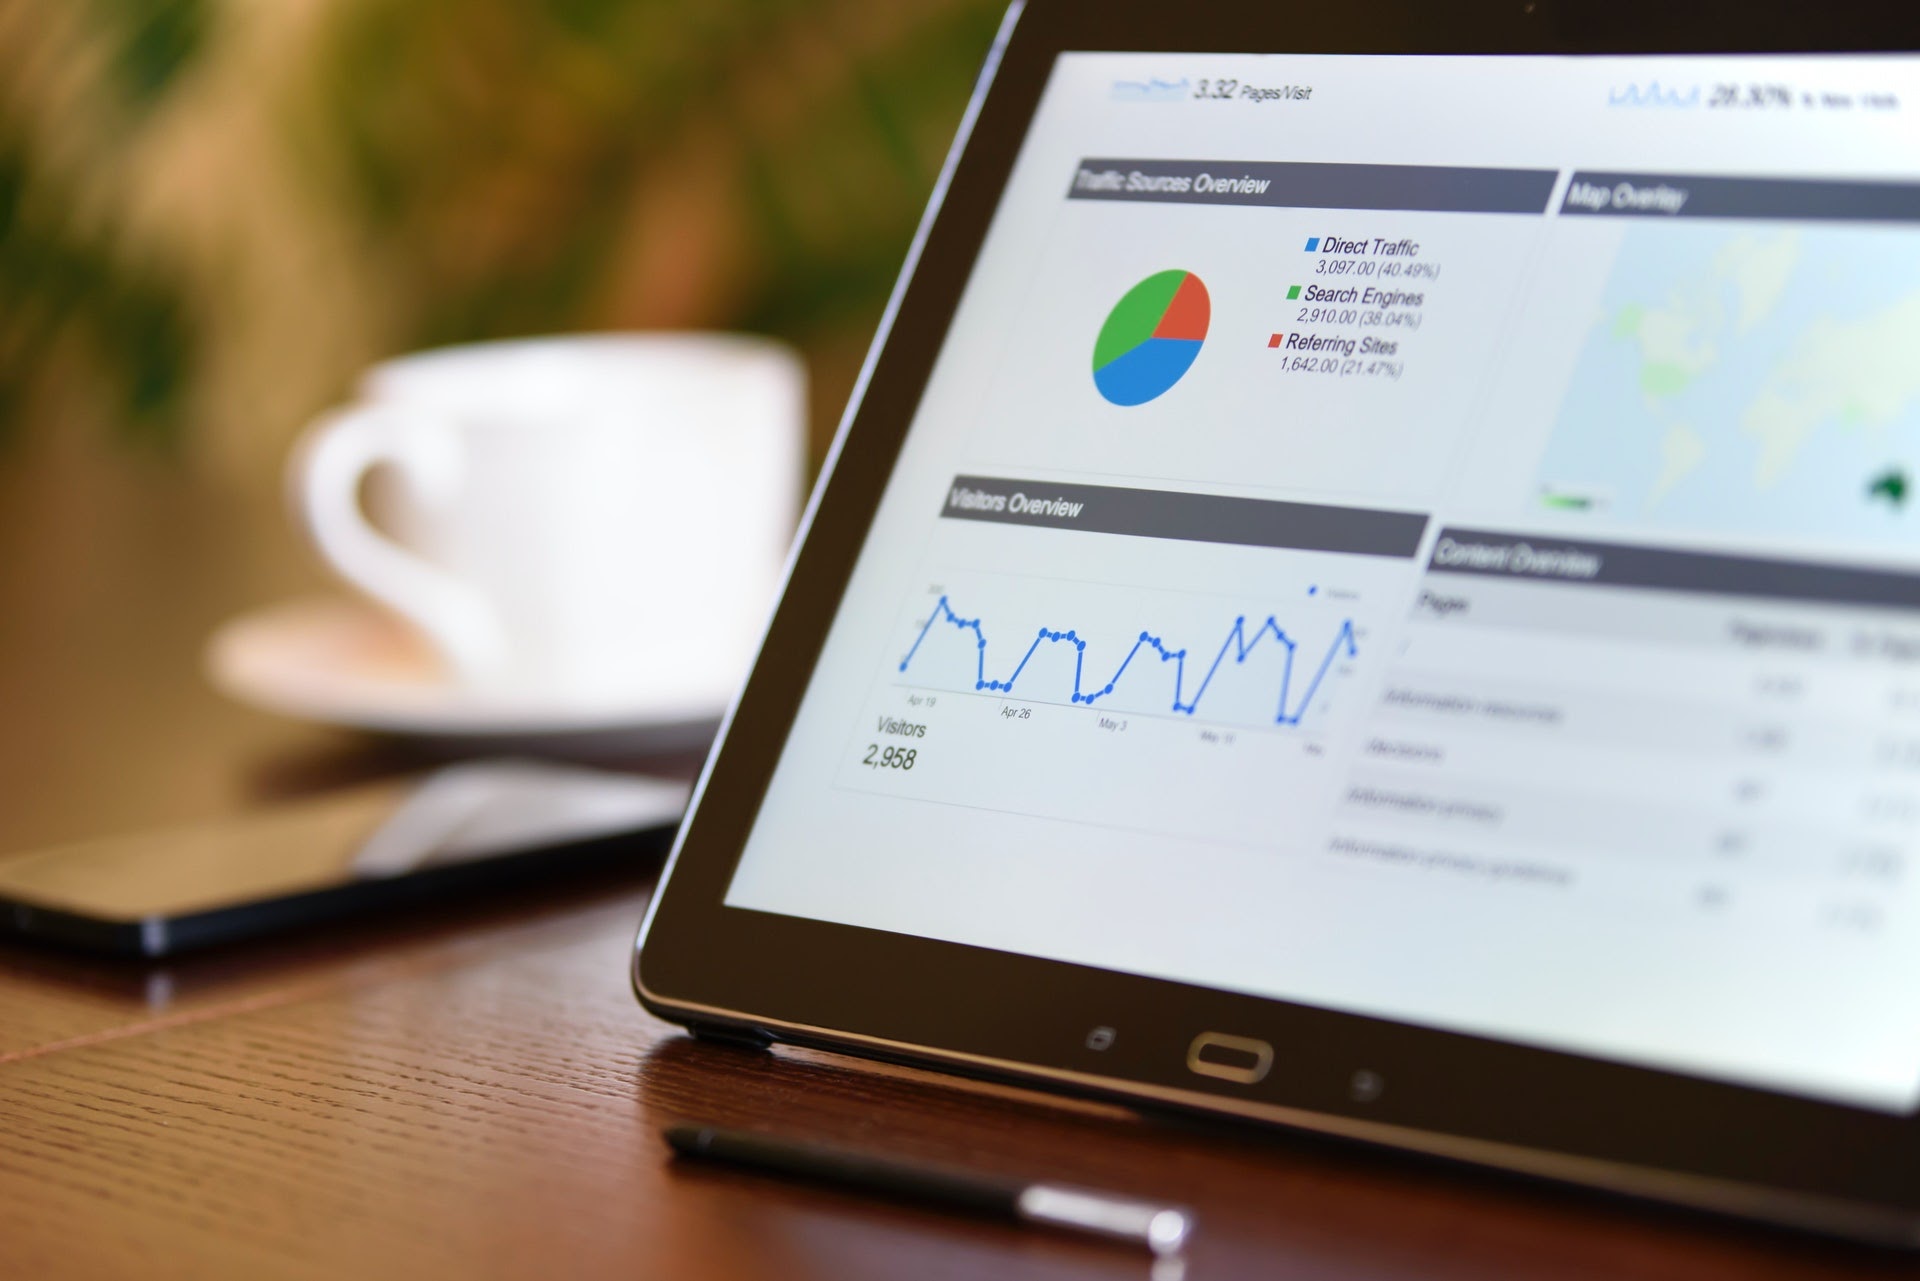
These are a measure of the metrics and performance of your posts. The Instagram analytic tool exists to help you uncover useful insights about your page and track the progress of your campaigns.
You can access your data in one of two ways. Either through the native Insights tool or using a third-party app. The former is always the best because it keeps all your information safe and in-house.
You don’t want to give out your passwords to a third-party site and wake up one day to a hacked account. But to use insights on Instagram, you need to have a business or a creator account.
Knowing what Instagram analytics are, is just the first step of the process. You need to be able to use these data to your advantage—putting your business in the right direction.
Now, let's discuss various Instagram analytics and how they can affect your IG page.
1. Understanding your data
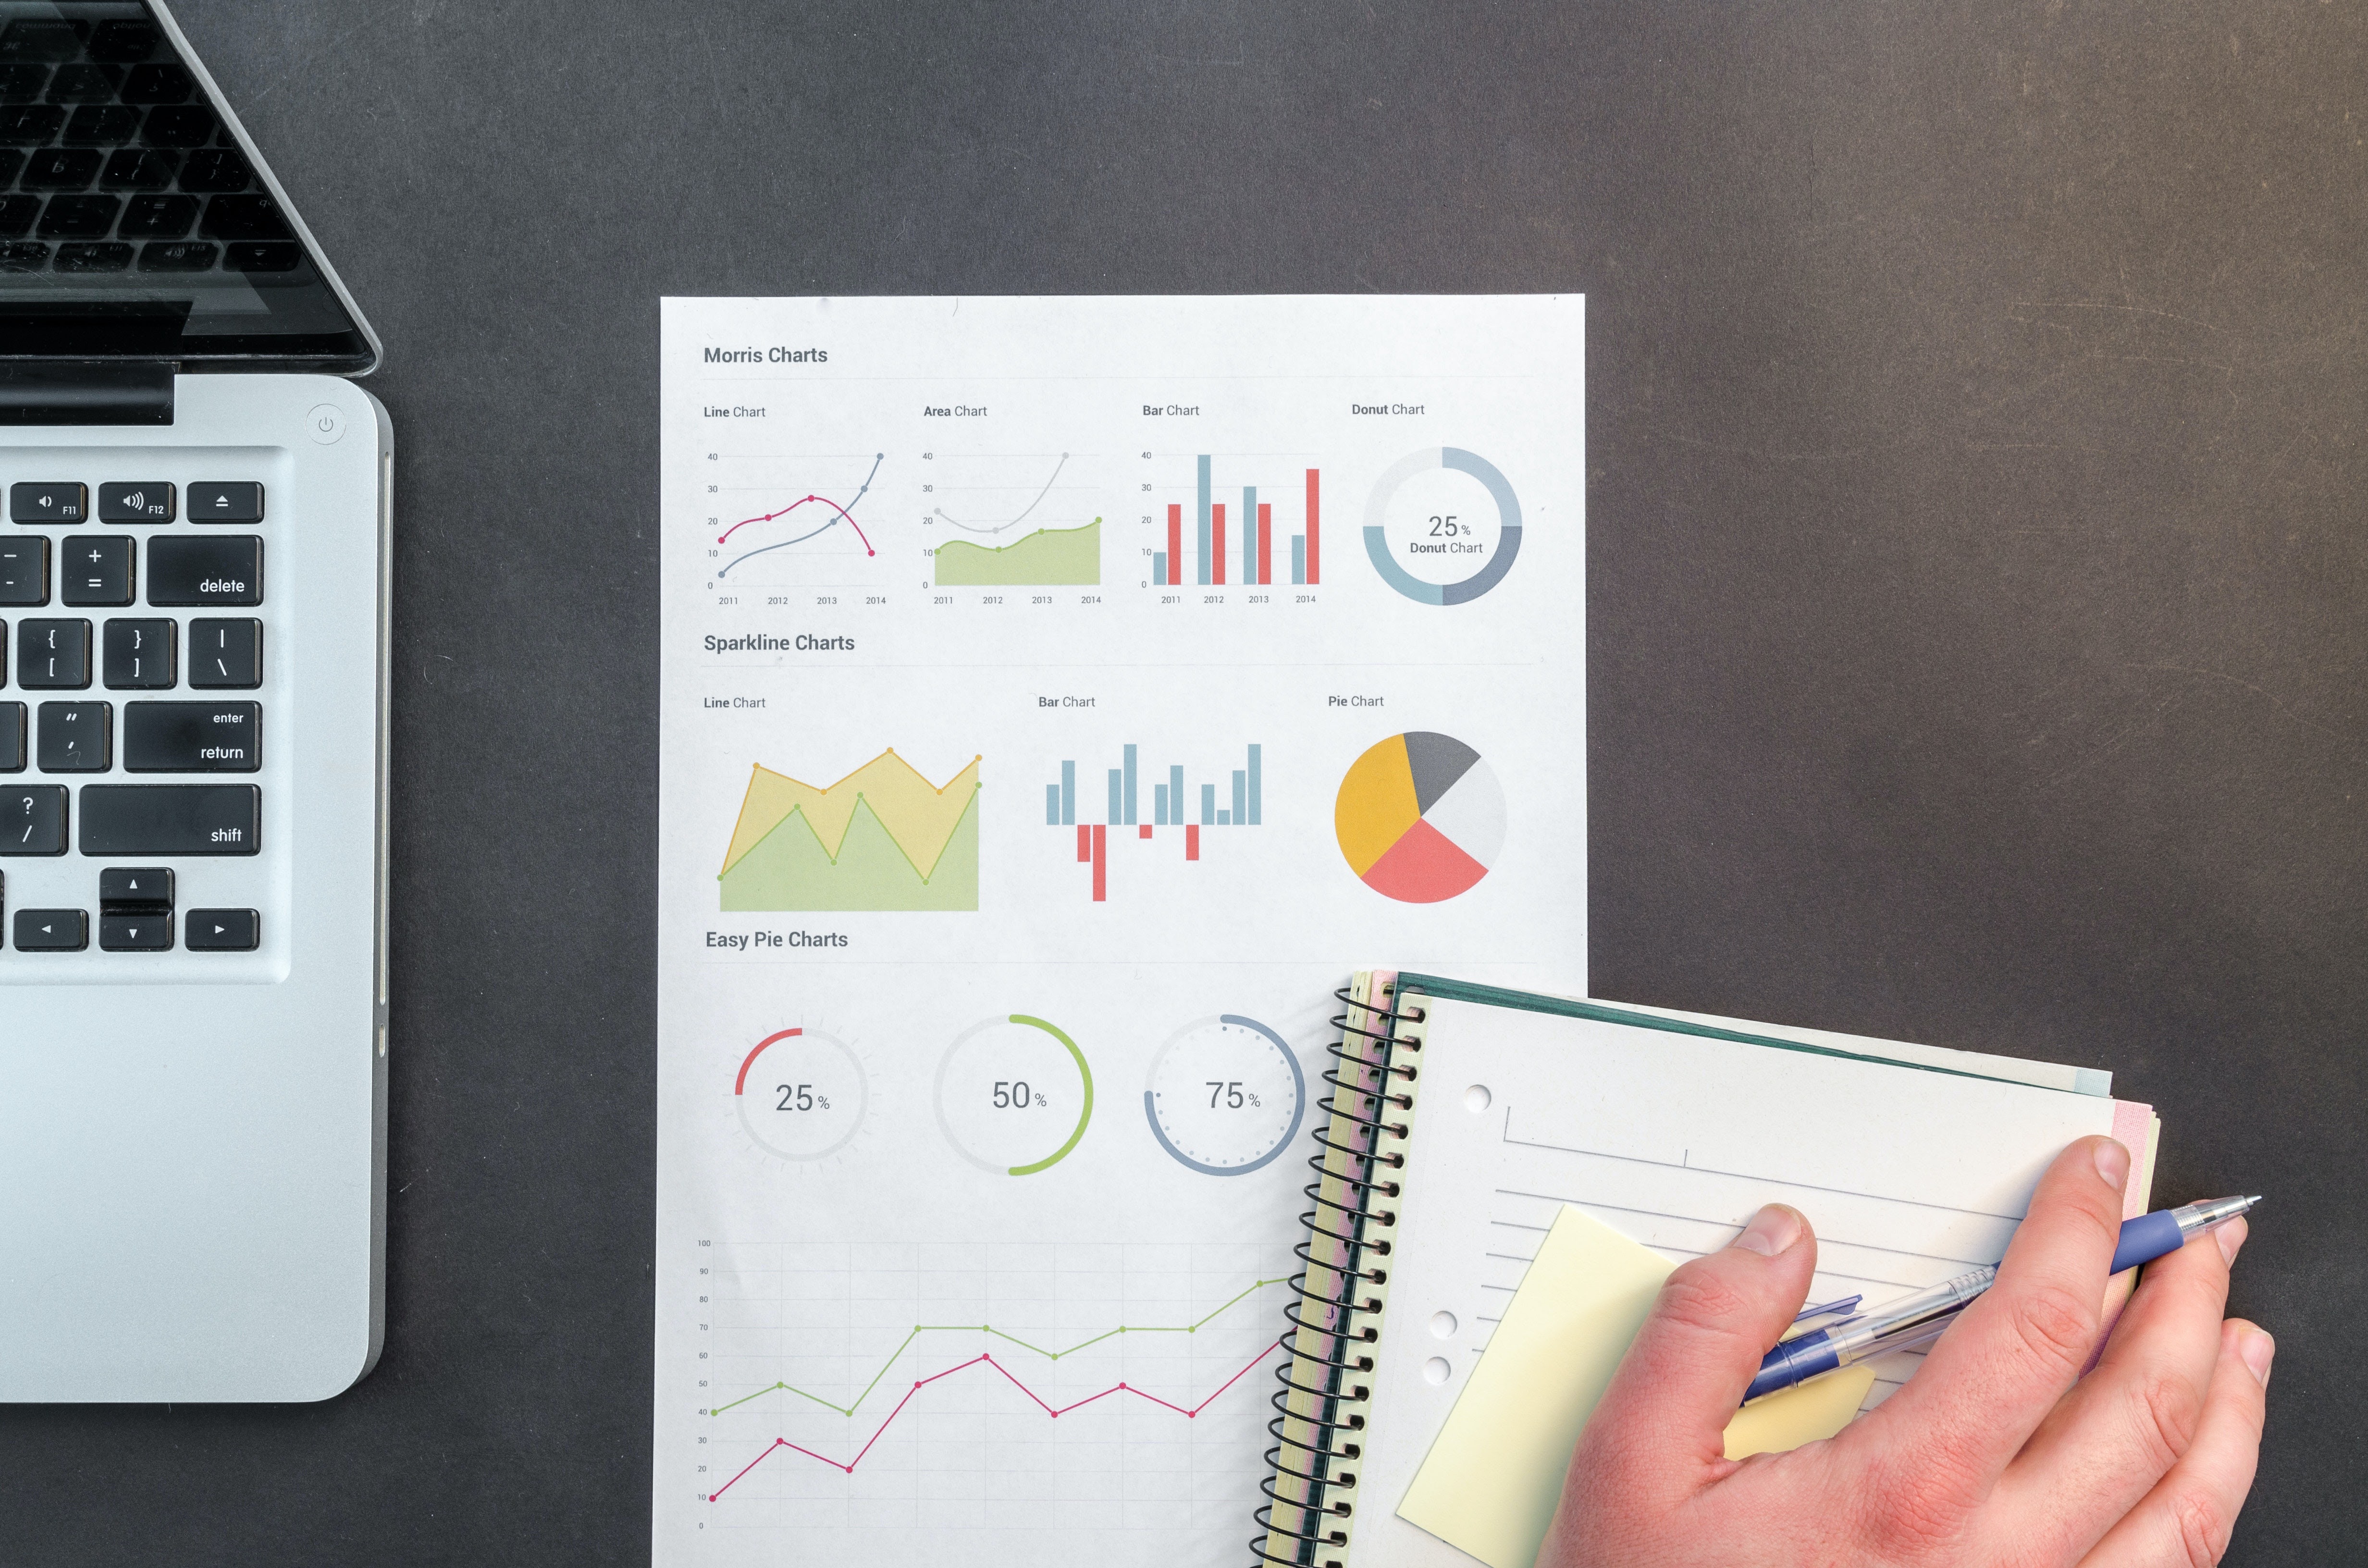
Before you start combing through your insights and data, it's important to understand the data you already have. Look at statistics such as your growth rate over the past few months.
-
How many new followers are you getting each month?
-
How many followers did you lose during that time?
This is a great way to know how well your business is growing over time.
Apart from your follower count, you should also know your interaction rate. This is the percentage of people who interact with your posts.
There are a couple of formulas but here's the easiest one:
[Metric you want to measure (e.g., number of interactions on a post) / Follower count when the post was published] x 100 = Rate (%)
This formula tells your engagement rates—an opportunity to further optimize your marketing strategy. The higher your interaction rate, the more your followers resonate with your content. Which means you’re definitely doing something right.
2. Instagram insights
By now, you should have switched to a business/creator account, giving you access to your page's insights.
Once you open up the dashboard, your data is broken down into 3 sections:
-
Overview
This one includes accounts reached alongside content interactions.
As the name suggests, your Accounts Reached tab shows the number of accounts you have reached within a specific time frame (7, 14, or 30 days). You get your impressions per day and the number of accounts that visited your profile, clicked on your link, and even which of your posts commanded the highest reach.
These are important metrics for any business page. You get to see which of your posts or stories did well in terms of statistics and over time, you can use this data to strengthen your SMM strategy.
E.g., if you get more viewers each time you post dresses as opposed to bags and pieces of jewelry, it shows what your audience prefers.
Your next course of action should be to either change the way you post them or couple them in posts that have dresses and then market them as a full outfit. These are just some of the few solutions statistics provide.
-
Your audience
So you don’t constantly have to go back and forth with manual calculations. Your Audience tab displays your overall growth, follows, and unfollows so you don’t have to do it on your own.
You can also see the top locations of all your followers from countries to cities. This way, you can easily create a demographic to base your Instagram marketing strategy.
This tab allows you to see how your followers stack up in terms of gender and all sorts of specifics.
-
Content shared
This one provides the various stories and main-feed posts you’ve made based on the time you select. You can then see which of the metrics of selected posts.
You can check your post shares, comments, likes, reach, call button taps, email button taps, impressions, post interactions, profile visits, saves, text button taps, video views, and website taps.
Data from these metrics are precious to any business handler or social media manager. It easily gives an insight into how well a business is doing and areas you can improve.
Key takeaways
Analytics can lead to different ways to improve your Instagram page. One of the first approaches is simply to change your posting times according to the insights.
Through your audience analytics, you can see the best times to post, giving your content the right amount of exposure.
You can also tailor your marketing strategy based on the demographics you discover. If you have over 70% male audience, then you need to reconsider if selling women’s wear is best. Or maybe you're selling to a certain class of men.
All in all, you may want to engage in campaigns that will target the demographic you have or begin to craft a new demographic from scratch.
Various ways exist for your business to use Instagram analytics. Explore different tabs and find what works best for you. And don't be afraid to experiment.